Quarterly Update: Office Market
The Partnership sends updates for the most important economic indicators each month. If you would like to opt-in to receive these updates, please click here.
Estimated Reading Time: 2 minutes.
The Houston office market logged 585,306 square feet of net absorption in Q2/25, marking a strong rebound following the significant 845,223 square feet of negative net absorption recorded in Q4/24. For the full year of ’24, net absorption totaled negative 900,668 square feet. This pattern of fluctuating absorption remains a recurring trend for Houston, with negative net absorption recorded in four of the past five years and six of the last ten—signaling that more space was vacated than occupied during those periods.
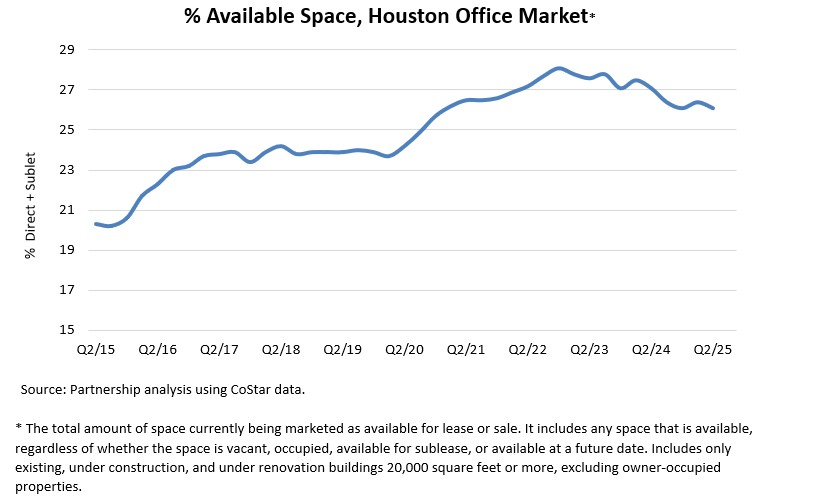
Since Q2/15, net absorption in the Houston office market has averaged negative 121,737 square feet per quarter, underscoring ongoing challenges in balancing demand and supply. This persistent pattern has led to a substantial increase in available office space. The availability rate, which includes vacant, soon-to-be-vacant, and sublease space—stood at 20.3 percent in Q2/15. Over the past decade, prolonged periods of negative absorption pushed availability to a peak of 28.1 percent in Q4/22, before easing to 26.1 percent in Q2/25.
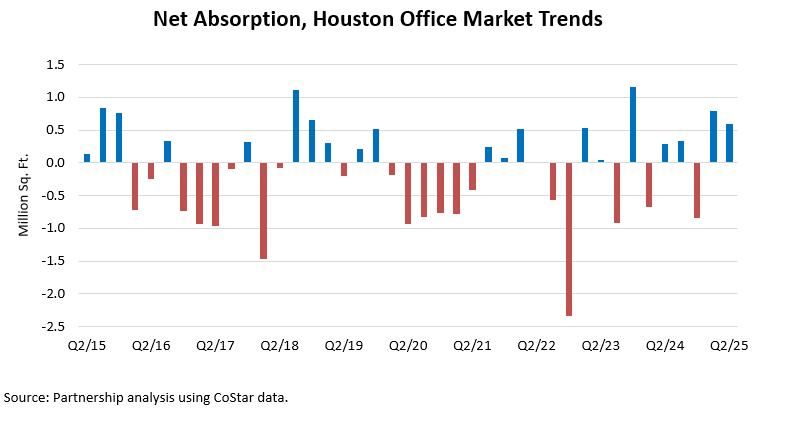
Negative absorption over the last ten years has dumped a considerable amount of space onto the market.
By class, the breakdown of available office space is as follows:
- Class A: 40.4 million square feet
- Class B: 24.9 million square feet
- Class C: 1.8 million square feet
Given the current availability of space, the number of expiring leases, and historical absorption levels, the office market will face continued challenges in reducing vacancies to healthier levels. While availability declined slightly to 26.1 percent in Q2/25, the market still has a long way to go before returning to pre-‘15 conditions, when availability rates were below 20 percent. Significant positive absorption and new demand drivers will be essential to meaningfully reduce vacancy levels.
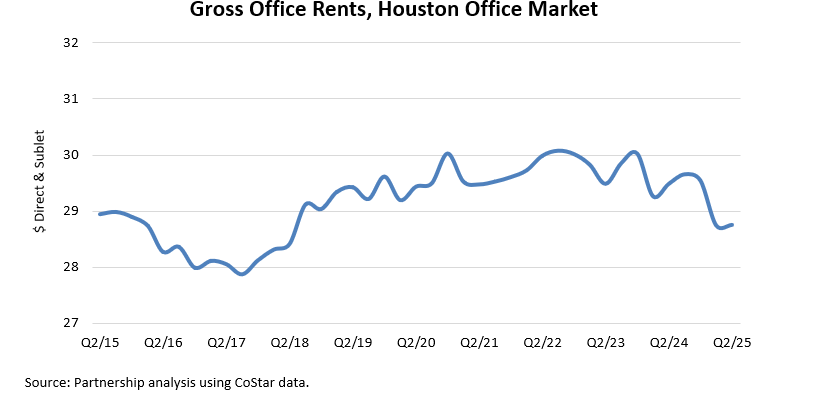
Negative net absorption has continued to pressure landlords, preventing them from raising rents. Gross asking rent in Q2/25 was $28.75 and fluctuated between a low of $27.87 and a high of $30.07 since Q2/15. Gross rents include taxes, insurance, maintenance, and the rent paid to the owner. When adjusted for inflation, gross rents have effectively declined, underscoring the market’s ongoing difficulty in achieving meaningful rent growth despite stable nominal rates.
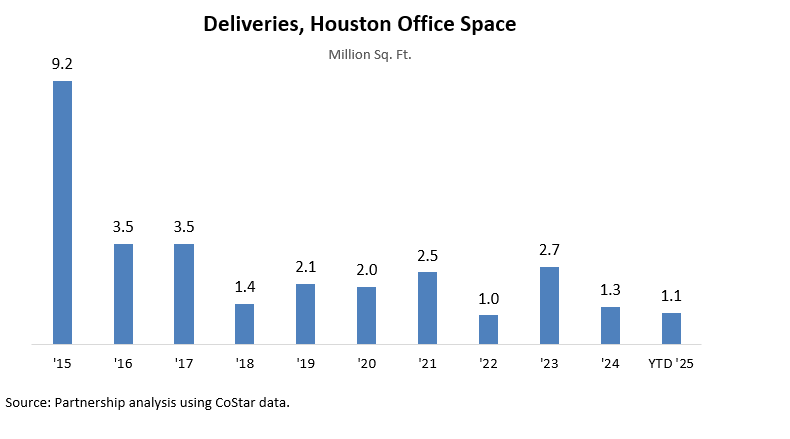
Office construction remains constrained by the oversupply of space and lack of rent growth, leading to a notable thinning of Houston’s construction pipeline over the past few years. ’22 saw the least amount of new office space delivered in the past decade, with just under 1.0 million square feet completed, followed by approximately 2.7 million square feet in ’23 and 1.3 million square feet in ’24. As of Q2/25, approximately 1.5 million square feet were under construction, representing 0.6 percent of Houston’s total inventory of 256.0 million square feet and well below the 10-year average of 3.5 million square feet. Medical office projects accounted for 33 percent of space under construction in Q2/25, totaling just over 500,000 square feet, with a high percentage of this space preleased, which should help minimize the impact of new supply on the broader market.
According to the Kastle Systems Back-to-Work Barometer, which tracks office entry card usage, Houston's office occupancy averaged 60 percent at the end of Q2/25. Austin and Dallas saw similar rates, while comparable metros reported occupancy levels between 40 and 50 percent.
When leases come up for renewal, tenants are scaling back their space needs or relocating to newer buildings and those with better amenities. At the end of Q2/25, the vacancy rate for newer buildings completed in the past 15 years averaged 14.9 percent compared to 27.5 percent in older, vintage buildings completed before ‘09.
Prepared by Greater Houston Partnership Research
Leta Wauson
Research Director
lwauson@houston.org